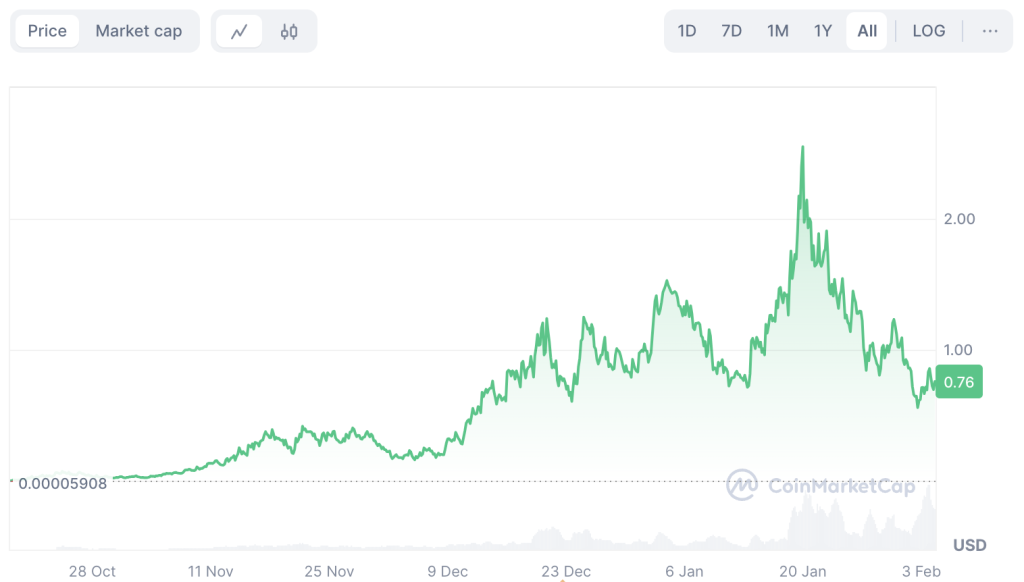
FARTCOIN, the memecoin that captured attention with its meteoric rise, has been in a sharp decline since hitting a new all-time high just 15 days ago. Despite plummeting by 70%, a bullish pattern is emerging that suggests a potential rebound for FARTCOIN.
Price Action: The Fall of FARTCOIN
On January 20, 2025, FARTCOIN reached a new all-time high of $2.61, but since then, its price has dropped significantly, currently trading at just $0.70. This dramatic 70.09% decline has left many wondering whether the memecoin’s fall is part of a larger market correction or if the coin is in trouble.


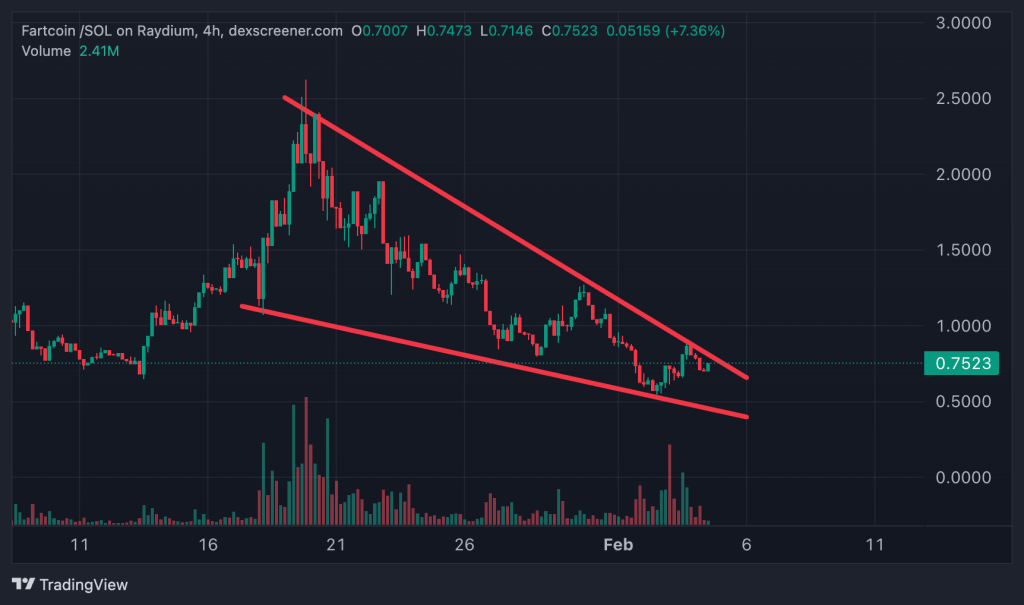
However, amid the ongoing correction, there may be some hope for a reversal. The price action has formed a falling wedge pattern on the 4-hour chart, which is typically a bullish sign. This pattern, which consists of two descending trendlines (one for lower highs and another for lower lows), signals that the price is narrowing within a range, potentially leading to a breakout to the upside.
The Falling Wedge: A Bullish Sign?
The falling wedge formation often precedes an upward breakout, and FARTCOIN’s current chart setup is showing promising signs. However, for this pattern to be validated, the coin needs to experience an increase in buying pressure. The price must also rise above the upper trendline of the wedge for the breakout to materialize.
If history repeats itself, FARTCOIN could erase a significant portion of its losses.
Indicators Suggest a Rebound
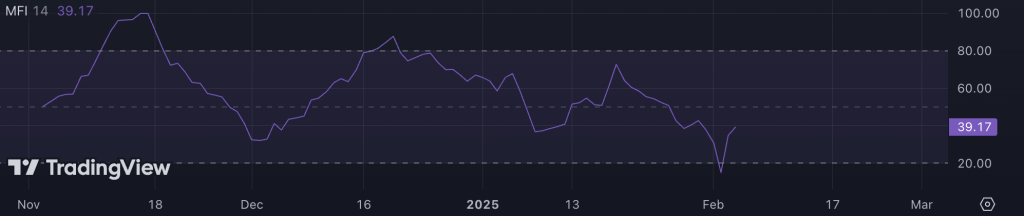
Looking at the daily chart, both the Money Flow Index (MFI) and Chaikin Money Flow (CMF) indicators are showing signs of rising buying pressure, further validating the possibility of a rebound.
- Money Flow Index (MFI): This indicator tracks the level of buying and selling pressure in the market, indicating whether an asset is overbought or oversold. FARTCOIN’s MFI was previously oversold below 20.00, but as of February 3, the indicator has started to rise, signaling that the token may be preparing for a rebound.
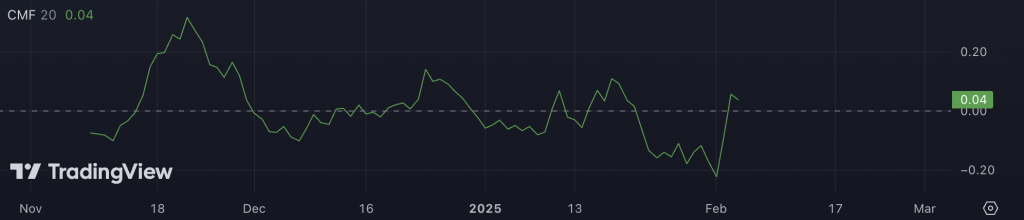
- Chaikin Money Flow (CMF): The CMF, which measures the accumulation or distribution of an asset, was previously in the negative region. However, it has since moved into the positive territory, suggesting increasing buying pressure. If this upward trend continues, FARTCOIN’s price could break above the upper trendline of the falling wedge.
FARTCOIN’s Price Targets
If the bullish momentum continues, FARTCOIN could target a return above $1.00. The next major resistance level lies at $1.70, the 0.618 Fibonacci level, commonly known as the “golden ratio.” Should buying pressure continue to build, FARTCOIN could see a potential rally to $2.16.
A Rebound or Further Decline?
While the technical indicators and pattern suggest a bullish reversal, the future of FARTCOIN is far from certain. If the rebound fails to materialize, the price could continue its decline, possibly dropping below the $0.50 mark.
The next few days will be crucial for FARTCOIN as it seeks to break out of the falling wedge and regain some of its lost value. Will it be able to reverse the trend, or is further decline inevitable? Time will tell.
Start trading memecoins